It’s been just over eight weeks since Delib launched Citizen Space Geospatial, and the response to date has been more than encouraging.
So what’s new?
At the online launch event in February, we told you that this was just the start for the technology and we’re already delivering on that promise. We’ve been busy investing time in developing functionality that further strengthens the core aspects of the platform, to make geospatial engagement easier for admins and those that respond.
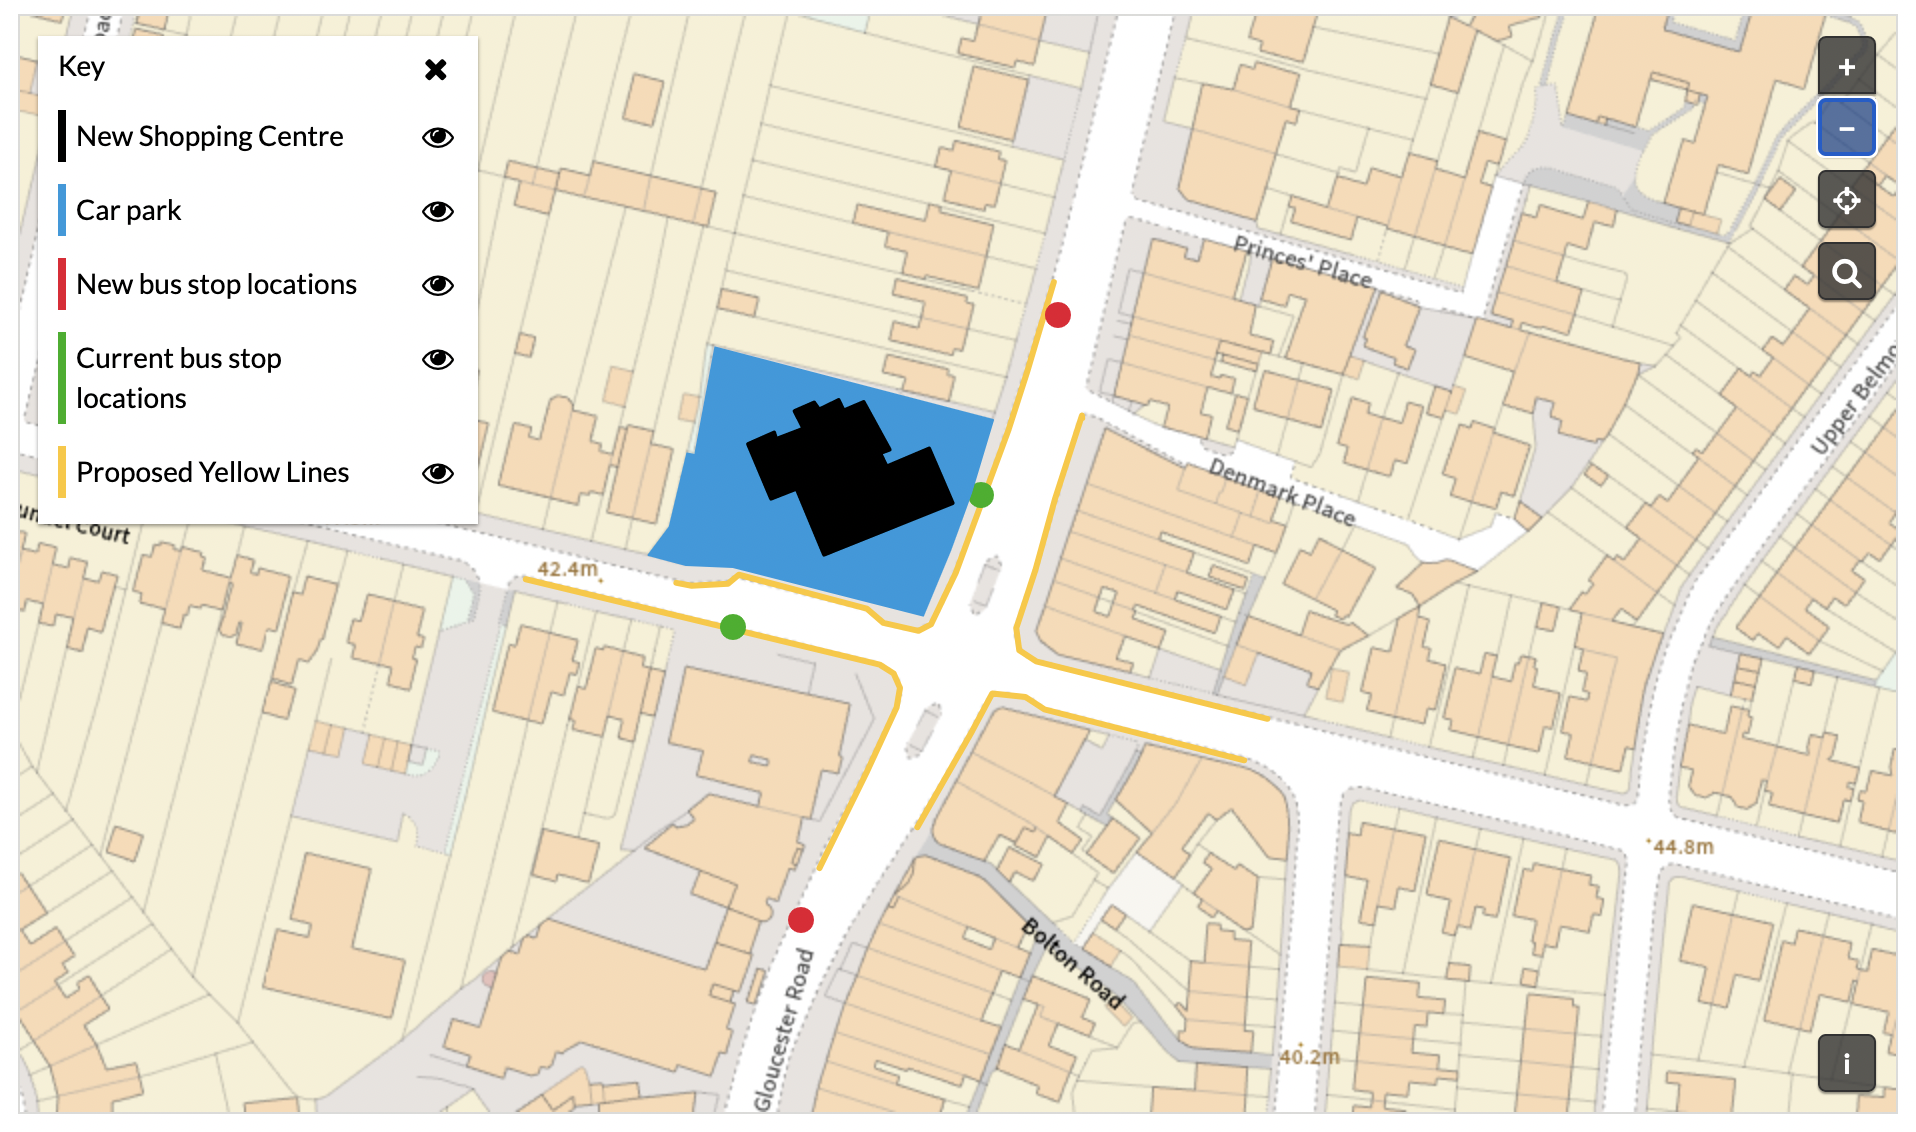
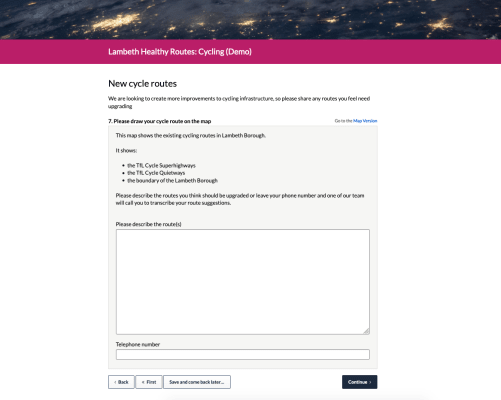
Even though the first version of Citizen Space Geospatial supported the import of geospatial data, which technical drawings are sometimes based upon, we wanted to help those whose start point for design is the technical drawing itself. This was initially difficult as these drawings often have additional information that are not available on a base map, notably: text labels, ‘street furniture’ (benches, lighting, bus stops), pavement/sidewalk widths, and trees, although I could keep writing that list for a while.
Most of this information could already be added if the admin had the appropriate geospatial data, which could then be added as an information layer with an explanatory key. However, for those who start, as we said before, with a technical drawing, you were previously a bit stumped.
All that has now changed. Admins can now draw such items as shapes directly onto the base map within Citizen Space, making it super quick, and really quite satisfying to recreate large aspects of those pesky CAD drawings.
Ultimately this is part of Delib’s continuing effort to help our customers move from documents to data, something we appreciate can be quite be a difficult transition.
Automated Summary Reporting
Continuing in the same vein, we heard LOUD and CLEAR how important easy summary reporting is through conversations with our existing Citizen Space customers. As a direct result we’ve now extended support for geospatial map responses to the existing docx Word summary report.
Our customers let us know that Citizen Space users depend on this for quick reporting, either as the basis for a public summary of results or as an easy appendix, and whilst this wasn’t available in the previous version, it’s very there now.
Reporting & Analysis – Clustering
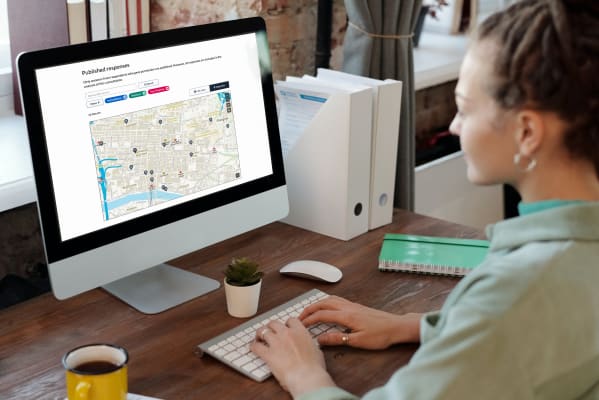
Delib’s goal is to always make it easy to comprehend the data our customers collect, helping them to identify trends and other points of note that can be acted upon. This is equally true with Citizen Space Geospatial and to that effect we’ve continued to work on the analysis and reporting dashboards, with a particular focus on data visualisation.
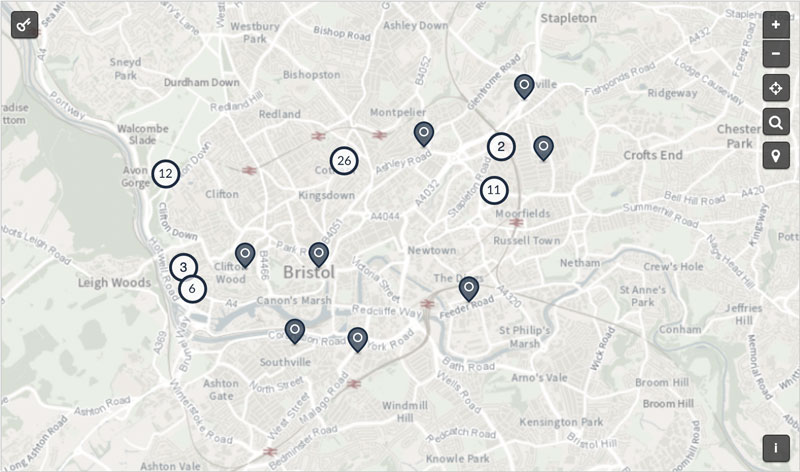
At launch it was already possible for admins to analyse core qualitative and quantitative data, and to filter and display geospatial data in integrated reporting dashboards. However, once there was a decent amount of geospatial responses, particularly if they were clustered in a small geographic area, it quickly became confusing without a healthy dollop of zoom being applied. Not a great outcome for anyone.
Happily, this is no longer the case. Geospatial responses are now clustered and represented by a numbered pin, rather than multiple pins. The admin can then choose to investigate this area more closely or it may be sufficient for routine high-level reporting. Happy days.
Reporting & Analysis – Colour coded filters
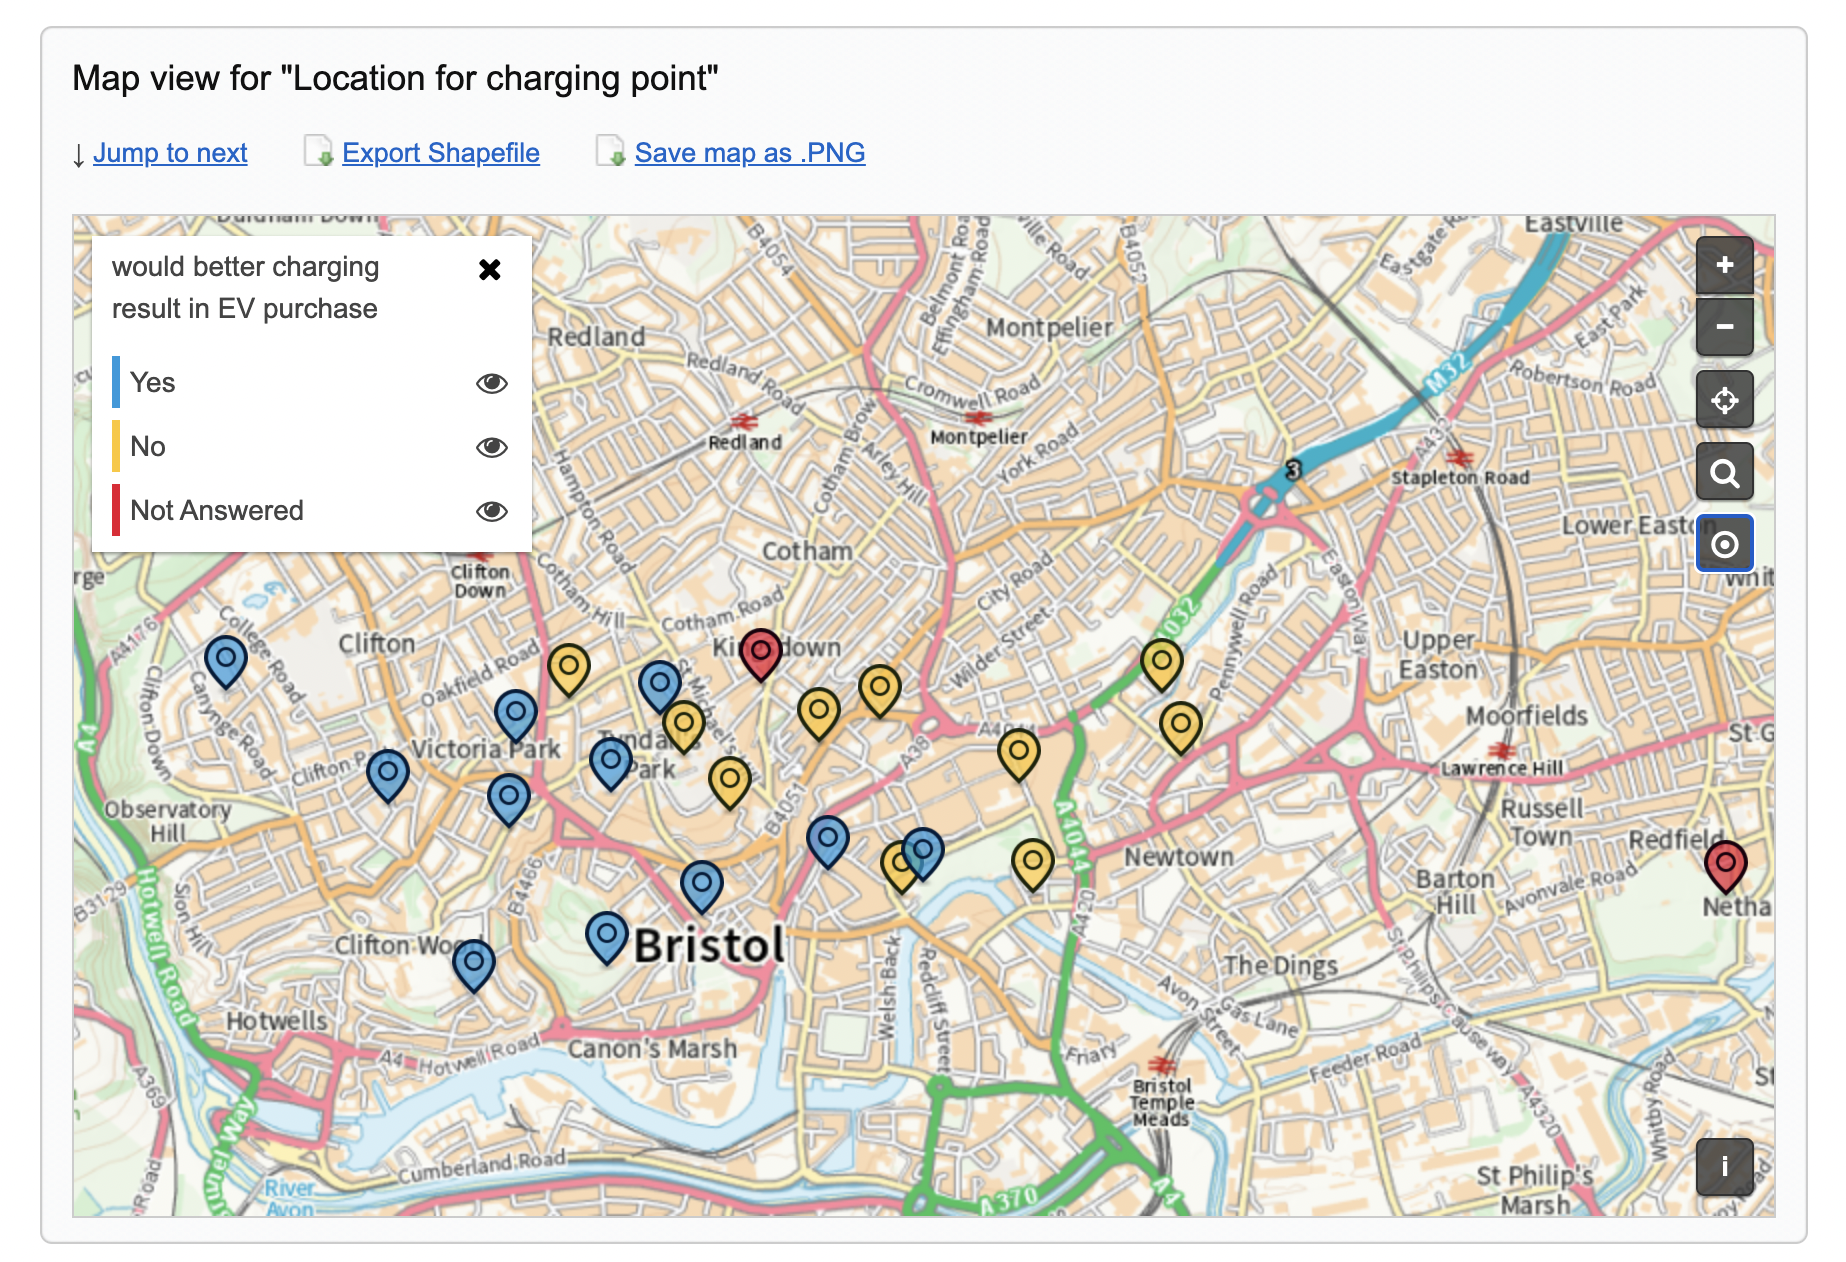
Building on the excellent new clustering options, we wanted to help admin users to also understand response data that isn’t geospatial but is linked to it. As an example, someone may have submitted a preference for a specific location, let’s say the best place for play equipment, and additional information about their general preference for the play equipment itself. The latter will be collected within a survey field but it’s directly relevant to the geospatial submission, which is both a challenge and an opportunity for those undertaking a summary report.
We thought long and hard about how we could best help with this, and as a result you can now display responses from others questions directly onto the reporting map, with colour coding and a key to make it easy to interpret.
This represents the first step in doing a whole lot more with data visualisation, so watch this space for the next few releases.
What’s next?
Better, faster, stronger.
Organisations are subscribing to Citizen Space Geospatial at a rate of knots, which has validated the product and should provide a rich evidence base for future development. As always, the updates will ship for no additional charge as they’re included within the subscription – More for Less.
To find out more about Citizen Space Geospatial book a demo and we’ll walk you through it.
Resources
Place-based engagement with Citizen Space Geospatial
Include maps and geospatial data throughout your consultation and engagement activities.

Citizen Space Geospatial was designed based on user research involving over 20 government organisations. You can read about the user research journey here.
How did we go about building Citizen Space Geospatial? What were the challenges? You can read about the engineering journey here.
How can geospatial tools include people who, for whichever reason, can’t use a map? Read about how we designed for accessibility and inclusion.
What is geospatial data? Why is it important for democracy, consultation and engagement activities? Read a detailed overview.