Delib has created a new product: Citizen Space Geospatial. It’s a geospatial capability that can be added to an existing Citizen Space subscription. There isn’t another tool on the market that can solve problems with place-based democratic processes in the same way.
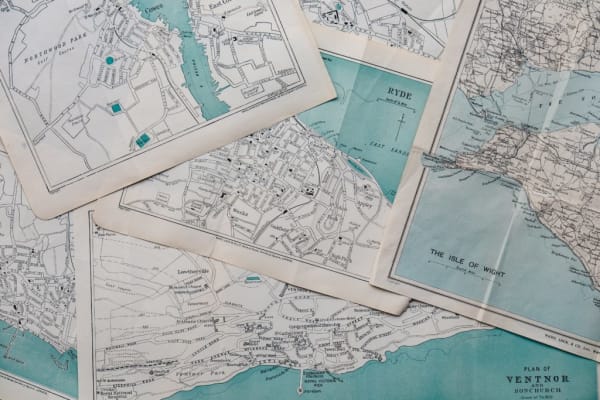
Most planning and place-based democratic exercises involve reliance on paper maps. This product removes paper from processes like Calls for Sites, Traffic Regulation Orders (TROs), Local Plans, and so on, instead harnessing valuable geospatial data to inform government decision-making. The implications are huge, both in terms of time and resources saved (e.g. from drawing potential sites for development on a paper map, scanning it in, and so on) and in ease of access for citizens.
There are plenty of consultation and engagement tools that allow users to drop a pin and leave a comment, but none other that is fully interactive with total back end integration.
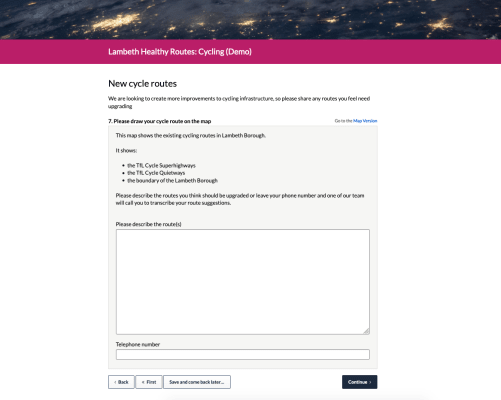
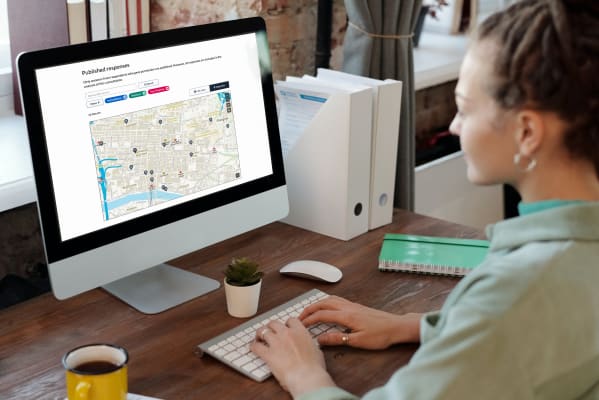
Citizen Space Geospatial allows respondents to add sophisticated custom responses, like drawing a shape or a route, which are then converted into usable geospatial data in the back end that can be imported into an existing GIS system. Admins can create beautiful custom reports and filter responses by post code and other demographics.
This made for an interesting and complex development journey.
It took about a year to build, with a dedicated team focussing only on Geo (as it’s known internally) for that whole period. This post gives an overview into the engineering work that went into it, as told to me by Jess (J) and Shaney (S), the developers who worked on it.
Not our first rodeo
We actually ventured into the world of mapping once before, years ago. We built a mapping question in a custom project, and it served its purpose, but it wasn’t without its limitations.
Tell me about the first time you waded into the world of geospatial, Jess.
J: It was a cell-based mapping question – we made it around 2011. We wanted an easy user experience and didn’t need exact data. It involved putting icons on a grid over the top of an image, an uploaded map of a bit of London. A bit like a tile game, rather than actually interacting with the map. But there was no way of visualising the responses, in aggregate or individually. This is the first time we’ll be able to publish responses on a map.
S: If I haven’t broken that.

Could we have built what we have now in 2011?
J: I very much doubt it. All of the things we’re using now, like OpenLayers and OpenStreetMap, they probably existed but in very primitive forms. We’re also making use of the fact that the Ordnance Survey now make all of their data available for free to UK public sector organisations – that’s a relatively recent development. Previously the licensing of things would’ve been too complex to navigate.
S: Also the technology wouldn’t have been there. Even now, we’re pushing the edges up of modern browsers and legacy browsers, and the situation 10 years ago was…well.
J: In the last few years there’s been a big government-led push to actually have things like the Ordnance Survey and all this other geospatial open data stuff available. Open data stumbled for a while but it’s really become a proper useable thing quite recently. GDS [Government Digital Service] and MHCLG [Ministry for Housing, Communities and Local Government], etc, are building these national registers of brownfield sites and land banks from data fed to them by local councils, and the data we produce will be part of this ecosystem.
Delib is building the plumbing for democracy. We want to build the plumbing that the data that drives decisions flows through.
S: Also in 2011 the technical understanding among would-be users wouldn’t have been there. There’s a public sector need for our product, but there’s also a public aspect of both wanting it and being prepared to interact with it. Geospatial tech has been around for a while but has been growing and growing; we all have phones in our pockets, everyone goes on Google every day, you just expect to be able to look up where your nearest petrol station is or how to get somewhere by bike. 10 years ago it was a novelty and you wouldn’t have expected to be able to do that.
J: If we just wanted a mapping question in a conventional survey tool that just put pins on a Google map or OpenStreetMap, you weren’t worried about where the data was going, you just wanted to cluster some pins visually and put it in a PDF, which is similar to what we did 10 years ago, we wouldn’t need to worry about any of this stuff. But that’s not our vision, our vision is – Delib is building the plumbing for democracy. We want to build the plumbing that the data that drives decisions flows through.
Continuous improvement
Building a product that nudged up against the boundaries of what’s possible in terms of, for example, what browsers can do, or what data sets are available, highlighted some issues we needed to fix with our existing tech, too.
We’re continually improving Citizen Space, and building this new capability highlighted some areas that needed extra attention in order for the platform to support geospatial capability.

What areas for improvement were brought to light by building this product?
S: It’s highlighted loads of areas for improvement in our response publishing. It also lead to lots of stuff around reporting, which Jess did.
Like what?
J: It started with the need to include custom reports in the responses by question, so we had to be able to show responses on a map, whereas previously our reporting had only supported showing things like tabular or qualitative data. We didn’t have a way of showing anything geographic. So that led to a restructuring of the whole mechanism, so that different question components can now generate different kinds of reports.
J: You have to be able to see the data and get it out in some kind of image form. You have to get it out in a way that you can import it into your GIS, assuming you have a geospatial team or access to a GIS, and you have to be able to export it in aggregate and for individual respondents.
How was the performance after that?
J: That made it horribly slower, which meant that we then had to put in a load of extra optimisation and indexing that have then made it in fact dramatically faster. One of the things has been really causing trouble for several years has been slow reporting and exports on large consultations, and now because of this extra indexing it’s potentially 10x faster.
S: Essentially through making this product we’ve also been able to improve reporting across the platform so that it’s much faster and more flexible. That has already been shipped, so it’s available to current customers.
J: And with the response publishing, we have an improvement stacked up and waiting to be released. Lots of behind the scenes improvements that’ll be released in due course, that were done as part and parcel of Geo but also will make the future of the platform stronger for everyone.
Through making Citizen Space Geospatial, we’ve also been able to improve reporting across the platform so that it’s much more flexible and up to 10x faster.
‘Making the complicated messy bits go away’
The geospatial sector is, to put it mildly, ridiculously complicated. There are numerous systems for creating 2D visual representations, called projections, of the lumpy, wonky, constantly-shifting, and very much 3D, physical world we inhabit. Most people have encountered some of these systems: they form the data upon which things like Google Maps are built. And they’re all different.
None of them is wrong, because the points it measures are correct relative to itself. But when you’re working with more than one of these systems, things start to get pretty messy, because they don’t match up perfectly.
Basically, the world is a satsuma, and a projection is the method/shape into which you flatten the satsuma peel. The most commonly used is the Mercator projection, which you see on most paper maps of the world.

What were some difficult or surprising things you came across? And did it cause any issues when building the product?
J: Even without factoring height, how the world is represented when it’s flat is not just a mathematical conversion. It’s not just numbers, it’s human and political and highly contentious.
S: And it’s not like they’re all neat tidy mathematical projections because, while theoretically they would be, as soon as you get into actually turning them into usable data, taking measurements on the ground, you just get a whole slew of historical inaccuracies that have been grandfathered in. It’s not a case of ‘you’ve got to move from this projection over to this one, so you just stretch it a bit and rotate it slightly,’ it’s more like ‘well this bit stretches, this shrinks, this bit’s wobbly.’ It’s like tossing two fishing nets on the ground and trying to interpret between them.
J: Even though we’re doing stuff like,putting a site/road/travel route on a map or putting where you want trees on a map, we’re in the world of GIS so we can’t simply ignore stuff like projections and base tiles and coordinate systems and converting between them and the output format, etc etc, because it would be wrong, and what we’re doing needs to be right.
S: We need to be aware of what [projection] we’re working in at a given time and at least have everything labelled correctly. That’s where a lot of the work has been, is discovering complexities and making them as simple as possible for our users.
J: A lot of what we do generally is making complicated things easy for our admins.
How did you manage that with Geo?
S: We picked some key processes to be our models and our things to prove it against. There’s always a level in software development where you have to pick a technology and that will start limiting you. It’s like if you’re starting from scratch it’s all Lego blocks and you can build anything, but once you’re halfway through building your giant rocket ship you’ve limited yourself and it’s a lot of work to undo it – but you have to start somewhere. That being said, those processes were helpful to have at the start, but as we got a bit more confident and built a foundation we started thinking more and more how Geo actually integrates into everything. So the final product that we’ve built is going to be quite flexible across a lot of processes.
It’s the work of a good system, making all the complicated messy bits go away. We have to be the experts so that the people using it don’t.
J: We don’t want the Geo tool to be a full featured GIS but it has to be compatible with one. It needs to be usable by both GIS and non-GIS users which was quite a challenge.
S: Yeah, there are different streams of people who will be using Geo that we had to keep in mind. You’ve got people who are using it casually and just want to have people put some things on a map and then have a look at where other people have done it, vs. those customers with a full-featured GIS team who want detailed data. You have to cater for both of those.
J: It’s a map usually so you need mapping representation, you need data out in aggregate, you need data out in individual and you need filtered data. We had to learn which are the expected file formats as well.
S: There’s a bit about finding the balancing point between being useful and trying to implement a full-on GIS. We have to be at the right spot between those to be like a bridge between consultation and an actual GIS. Also bearing in mind how huge and complex GIS platforms are, it wouldn’t make sense for us to try and be one.
J: Yes. We’ve done all the work and the research and making sure we get the projections right so that it can plug into a GIS if that’s what an organisation needs, but people don’t need to be experts in GIS to use it.
S: it’s the work of a good system. The work here isn’t in being able to ask a good question, it’s making all the complicated messy bits go away. We have to be the experts so the people using it don’t.
Introducing place-based engagement with Citizen Space Geospatial
Include maps and geospatial data throughout your consultation and engagement activities.
Find out more about Citizen Space Geospatial.
We’re confident that Citizen Space Geospatial solves a lot of problems for a lot of people. But who defines those problems and how specifically do you solve them?

Citizen Space Geospatial was designed based on user research involving over 20 government organisations. You can read about the user research journey here.

How can geospatial tools include people who, for whichever reason, can’t use a map? Read about how we designed for accessibility and inclusion.

What is geospatial data? Why is it important for democracy, consultation and engagement activities? Read a detailed overview.
To find out more about Citizen Space Geospatial book a demo and we’ll walk you through it.